Drawing graphs and automata in LaTeX
September 21, 2006
I am currently enrolled in a class entitled “Automata, Computability, and Formal Languages” at UNO. It’s a neat class. The professor requires us to submit our homework in both hard and soft copies. Naturally, he suggests we use LaTeX to typeset our homework.
Given that this is a class on automata, I end up drawing a lot of state diagrams to represent the machines I have to design for the problems. I wanted a nice way to draw these and put them in to my LaTeX document. The first thing I did was check to see if OmniGraffle exported to EPS, and it did. LaTeX can read EPS, so I was okay if I couldn’t find anything better.
With a solution in hand, I started to look and see if there was anything I could use to typeset these graphs right in the LaTeX source itself. Preferably something designed for drawing finite state-machines, even. What I found was GasTeX. It is a decently cool package.
The following source code from their samples page:
\begin{figure}[H]
  \begin{center}
    \unitlength=4pt
    \begin{picture}(15, 28)(0,-10)
    \gasset{Nw=5,Nh=5,Nmr=2.5,curvedepth=3}
    \thinlines
    \node(A0)(7.5,0){$0$}
    \node[Nmarks=i,iangle=90](A1)(0,13){$1$}
    \node[Nmarks=if,iangle=90,fangle=90](A2)(15,13){$2$}
    \drawloop[loopangle=180](A1){$a$}
    \drawloop[loopangle=0](A2){$b$}
    \drawedge(A1,A2){$a$}
    \drawedge(A2,A1){$b$}
    \drawedge(A2,A0){$a$}
    \gasset{curvedepth=-3}
    \drawedge[ELside=r](A1,A0){$b$}
    \drawloop[loopangle=270](A0){$a, b$}
    \end{picture}
  \end{center}
  \caption{La complétion de l'automate.}
\end{figure}
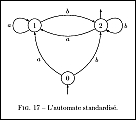
Generates this graph (which I have scaled down):

Example of GasTeX output
One note about this snippet, though, is that I did not have to use the center environment to center the figures. Instead I used the \centering directive inside my figure environment, and that worked nicely.
It’s nice to use and it makes pretty graphs. I’ll be using it for the rest of the semester, that’s for sure!